Second Pass at Analytics X Prize
by Anthony Fox | Jan 11, 2010
For my second attempt at predicting homicides in Philadelphia, I included roads in the model. I got the roads data from the census link in the last post, imported the roads into my PostgreSQL/PostGIS database, and visualized the resulting prediction using Quantum GIS connected to my PostGIS store. The following image was exported from QGIS:
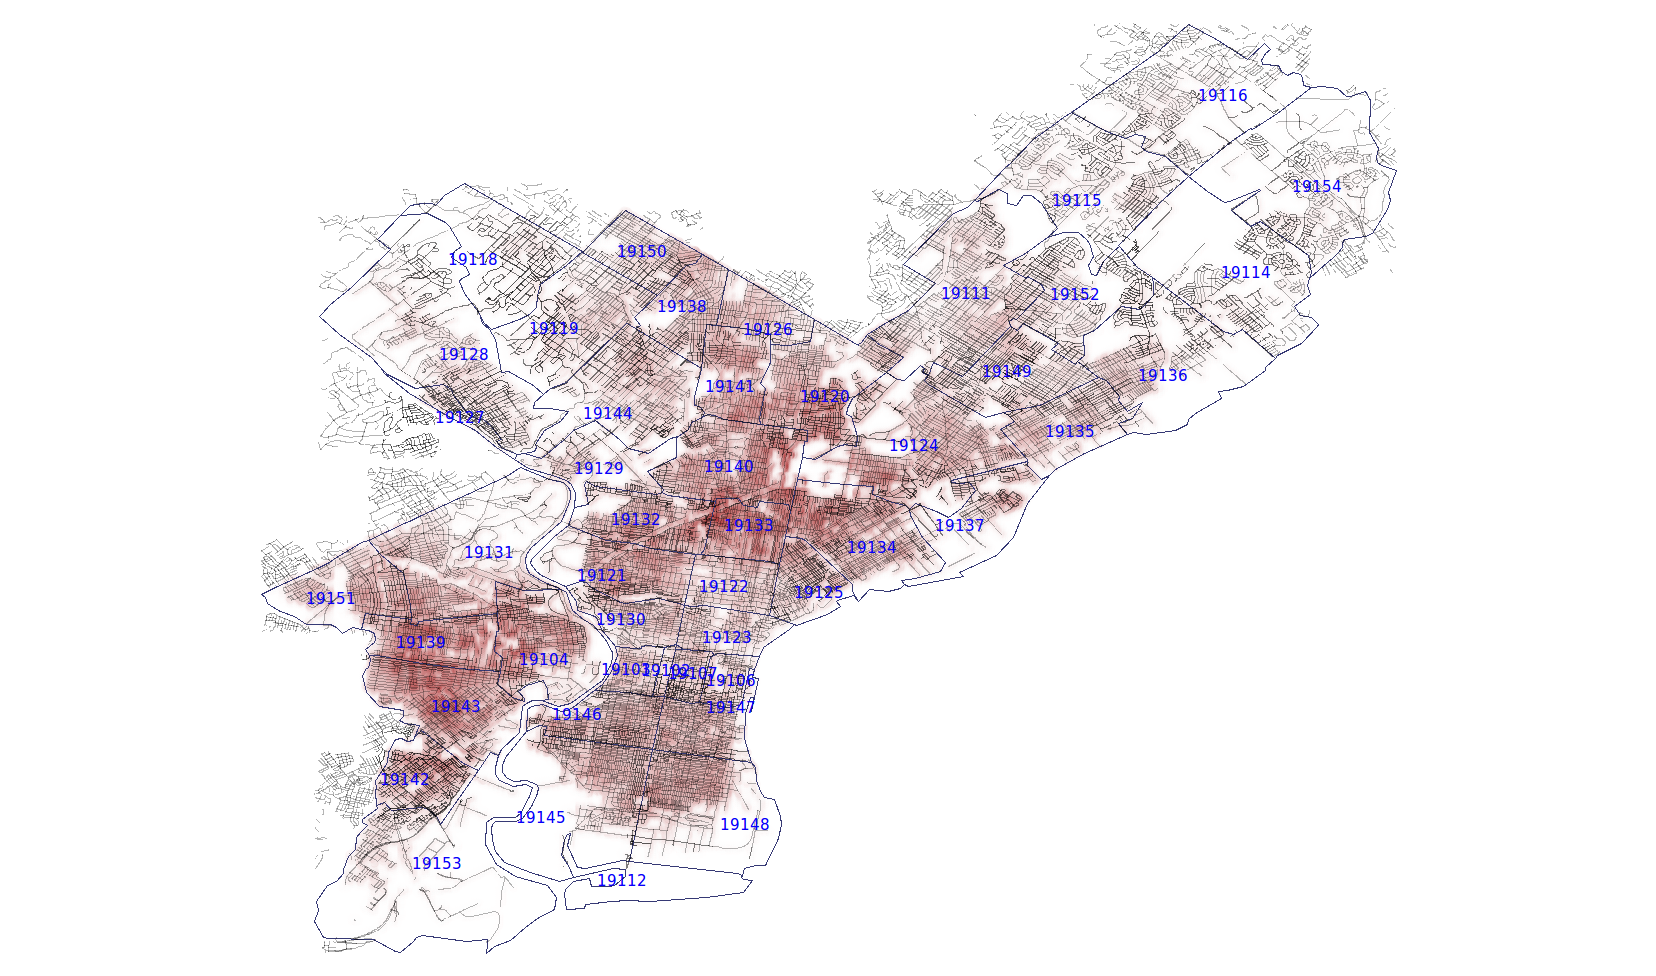
The image shows the Philadelphia zip codes, the local roads network of Philadelphia, and the new prediction as a red gradient where the deeper the red the more likely a crime will occur at that location according to the prediction.